HeroDashboard Business Intelligence Tool That Make Everyone A Power Analyst!
Grow your business with real-time analytics for data-driven decisions.
Benefits of Using Business Intelligence Tool
Data-Driven Decision Making
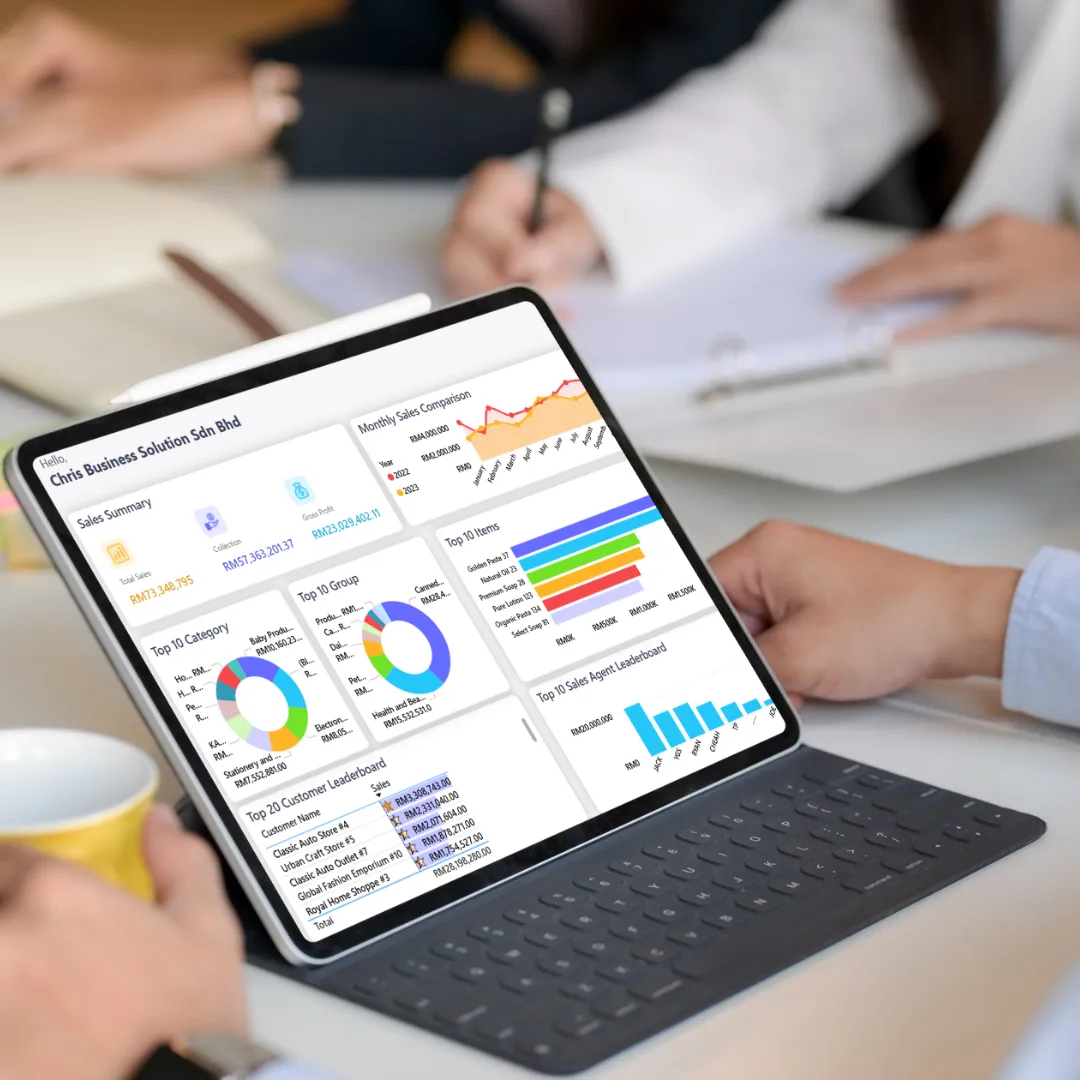
Business intelligence tools provide real-time insights that help companies make informed, data-backed decisions, leading to more accurate strategies and better outcomes.
Improved Operational Efficiency
By analyzing data across different processes, businesses can identify inefficiencies, streamline operations, and reduce costs, resulting in increased productivity.
Enhanced Competitive Advantage
With BI tools, companies gain insights into market trends, competitor performance, and consumer behavior, allowing them to stay ahead of the competition and adapt quickly.
Better Customer Insights
BI tools help businesses analyze customer data to understand preferences, behaviors, and needs, enabling personalized marketing and improved customer experiences.
Increased Profitability
By identifying trends, forecasting future performance, and optimizing resources, businesses can make strategic decisions that boost revenue, reduce waste, and maximize profits.

See What You Can do With HeroDashboard
Data Visualization
Our BI tool comes with interactive dashboards and visual representations of data, making complex information easy to understand and analyze.
Real-Time Analytics
HeroDashboard provide up-to-the-minute data insights, allowing businesses to make immediate, data-driven decisions.

Cross Sharing
Allow teams to share insights and collaborate on data analysis, making it easier for departments to work together and make unified decisions.
Customer Segmentation
Analyze customer data to create targeted segments based on behavior, demographics, or preferences, enabling personalized marketing strategies.

Inventory Tracking
BI tools provide real-time tracking of inventory levels, helping businesses ensure they have the right stock available.
Trend Analysis
Help businesses identify long-term patterns in their data, allowing them to anticipate market shifts and adjust strategies accordingly.
HeroDashBoard Provides Reports That Help You Make Data-Driven Decision

Sales Report
✅Sales Comparison Report: Analyze yearly performance growth for each quarter.
✅Agent Report: Monthly performance reports for sales agents.
✅Salesman Activity: Tracks the routes of sales personnel visiting customers.
✅Credit Note Report: Summary report of total returns.
✅Collection Report: Summary report of total collections
Customer Report
✅Customer Report: Monthly performance reports for each customer.
✅Customer Sales Report: Total sales contribution by each customer for the year.
✅CRM Report
✅Customer GPS: Maps the concentrated locations of customers.
✅Heat Map: Visualizes product purchasing trends, showing which products sell best in specific areas.
✅Reactivate Old Customer Report: Identifies strategies to re-engage inactive customers.
Item Report
✅Group & Category Report: Analyzes total sales of products in each group and category.
✅Item Summary: Tracks monthly and quarterly sales trends for each product to see if it's still on trend.
✅Item Sales Report: Total sales contribution of each product for the year.
✅Dead Stock Report: Identifies slow-moving or unsellable stock in the warehouse.
Profit Report
✅Profit Margin Report (Top 4% & 20%): Identifies high-profit, fast-selling products.
✅Quadrant Analysis Report: Analyzes product profitability and categorizes items based on their performance.
✅Customer Margin Analysis: Provides a profitability analysis for each customer.
✅Product Margin & Quantity Analysis: Examines product profitability along with the quantity sold.

Data Overview Report
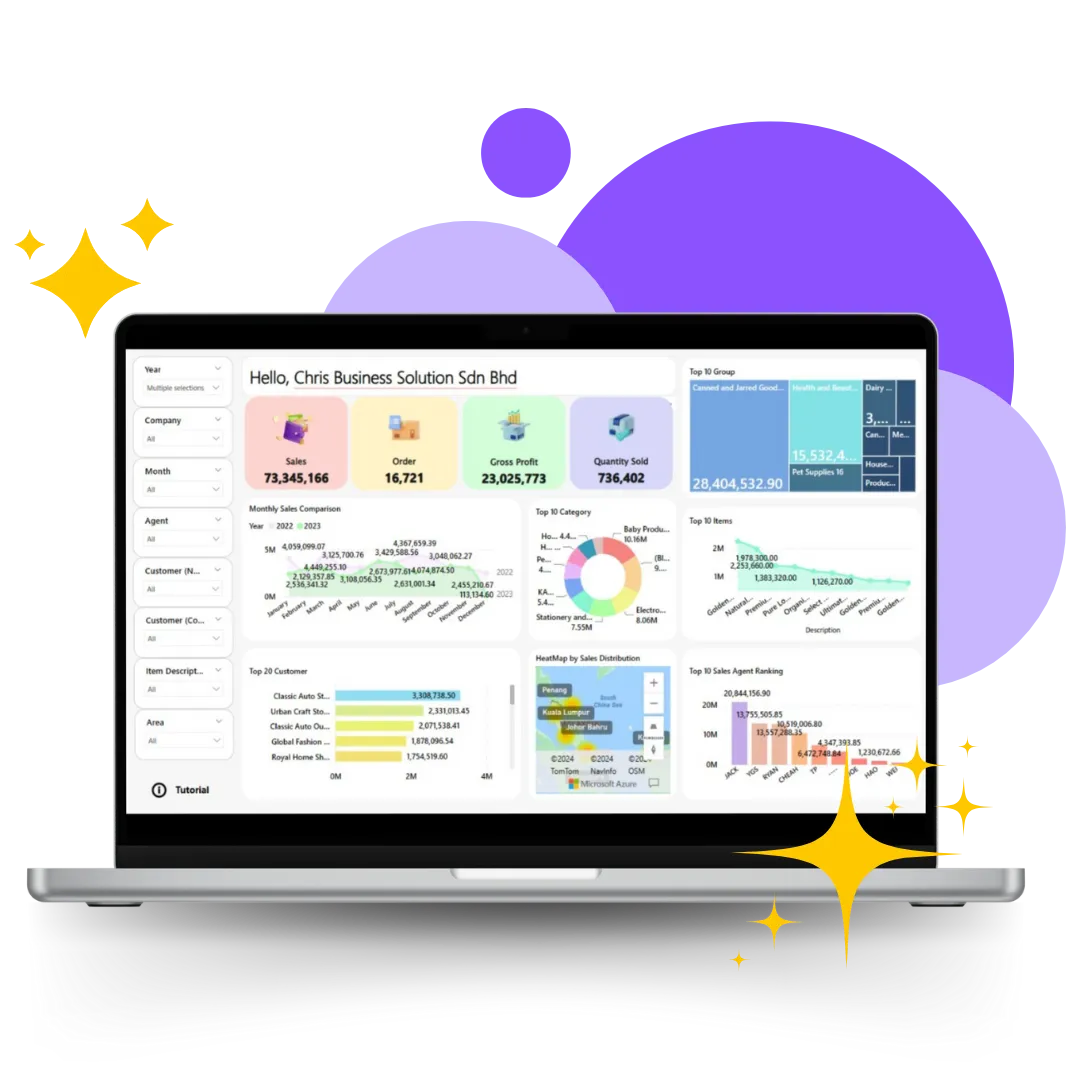
✅Dashboard Data Overview: Provides a clear view of key business data, including the top 10 categories, top 10 groups, top 10 items, top 10 sales agents, and top 20 customers.
✅Executive Summary Report: A concise summary of key business metrics and performance.
✅Business Report: A comprehensive report on the overall company performance.
✅Brand Report: Performance analysis of each brand within the company.
OUR CUSTOMER LOVE US

OUR CUSTOMER LOVE US
Let Us Take Your Business to the Next Level!
Have questions about our products / services?
Don't hesitate to contact us! Our dedicated team is here to assist you every step of the way.


