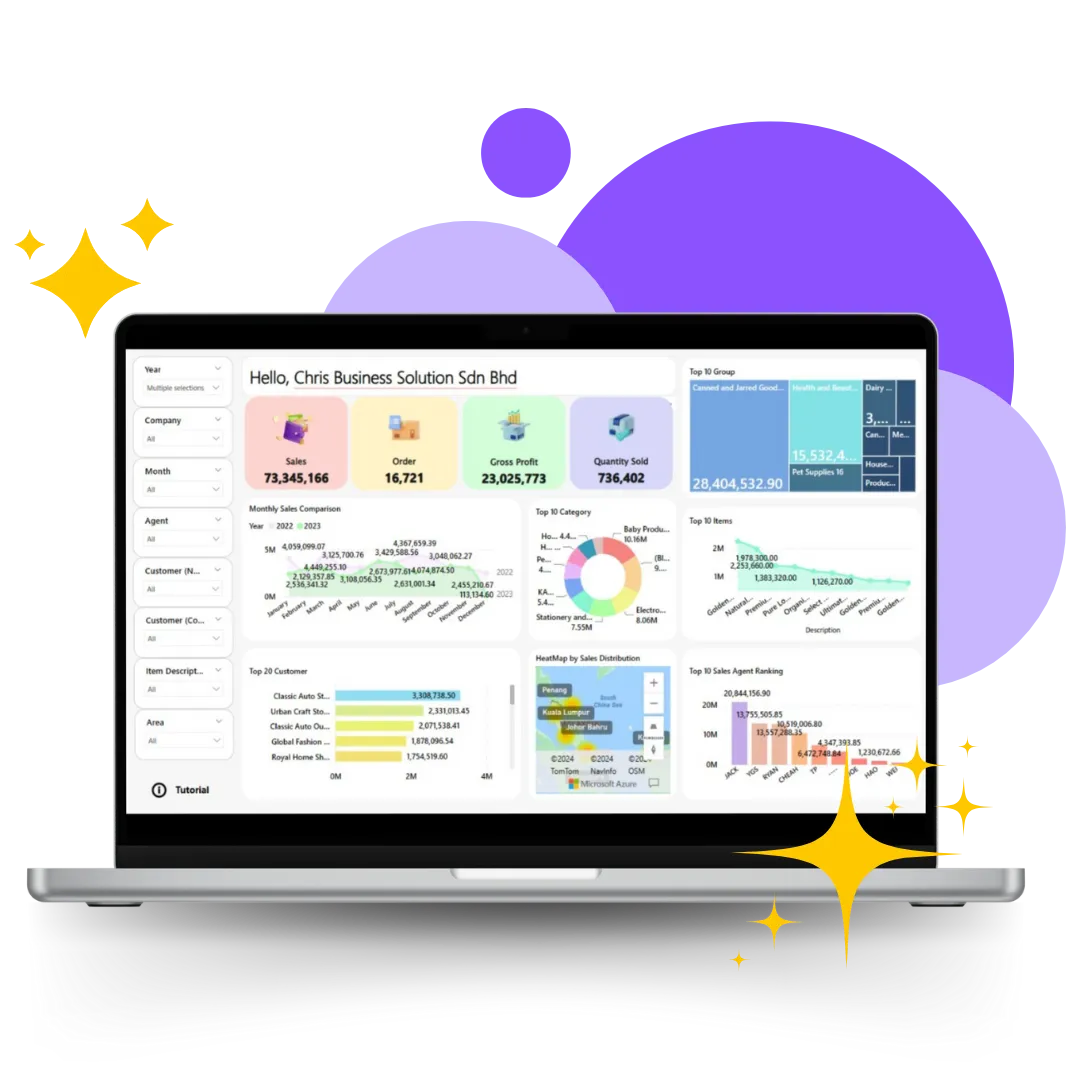
HeroDashboard Business Intelligence Tool That Make Everyone A Power Analyst!
Grow your business with real-time analytics for data-driven decisions.
Why Should You Use Business Intelligence Tool?
Data-Driven Decision Making
Business intelligence tools provide real-time insights that help companies make informed, data-backed decisions, leading to more accurate strategies and better outcomes.
Improved Operational Efficiency
By analyzing data across different processes, businesses can identify inefficiencies, streamline operations, and reduce costs, resulting in increased productivity.
Enhad Competitive Adncevantage
With BI tools, companies gain insights into market trends, competitor performance, and consumer behavior, allowing them to stay ahead of the competition and adapt quickly.
Better Customer Insights
BI tools help businesses analyze customer data to understand preferences, behaviors, and needs, enabling personalized marketing and improved customer experiences.
Increased Profitability
By identifying trends, forecasting future performance, and optimizing resources, businesses can make strategic decisions that boost revenue, reduce waste, and maximize profits.

See What You Can do With HeroDashboard
Data Visualization
Our BI tool comes with interactive dashboards and visual representations of data, making complex information easy to understand and analyze.
Real-Time Analytics
HeroDashboard provide up-to-the-minute data insights, allowing businesses to make immediate, data-driven decisions.

Cross Sharing
Allow teams to share insights and collaborate on data analysis, making it easier for departments to work together and make unified decisions.

Customer Segmentation
Analyze customer data to create targeted segments based on behavior, demographics, or preferences, enabling personalized marketing strategies.

Inventory Tracking
BI tools provide real-time tracking of inventory levels, helping businesses ensure they have the right stock available.
Trend Analysis
Help businesses identify long-term patterns in their data, allowing them to anticipate market shifts and adjust strategies accordingly.
What Makes HeroDashboard Stand Out

Helps integrate and blend data from multiple data sources, gain a holistic view of your business, and make better decisions.

Transparent, upfront pricing with no hidden costs. Offers the lowest TCO through affordable licensing, customization, training, and support fees.

Offers a drag-and-drop interface for visualizing data. Get to insights easily with augmented analytics capabilities.

Provides a comprehensive set of APIs that enable extensive customization options. These APIs allow for highly extensible low-code or no-code integration with any technology stack.

Incorporates time-tested and accredited security features designed for enterprise environments, along with a robust governance framework.

Easily connect and prepare your data to transform it into ready-to-use insights, right where it lives.

Combine data analysis with powerful AI to simplify complex data, automate workflows, predict trends, and get answers right from the source.

Unlock enhanced analytics and visualization with seamless Power BI integration for better decision-making.
Who Should Use BI Tools?
Business Types
Small and Medium Businesses
There was a time when BI software was expensive, and was used only by large enterprises. But Cloud Business Intelligence (BI) software solutions today are very much affordable for small and medium businesses (SMBs). SMBs increasingly take advantage of this fact, and use BI solutions on the cloud
Large Businesses
ImageAs the saying goes, "data is the new oil." Large enterprises use Business Intelligence (BI) analytics software to continuously mine and analyze data from across the applications and databases they use.
Departments
Sales
How is the sales pipeline looking for the next few months? Who are my top and bottom performing sales reps? Which regions and products should I concentrate on to maximize profits? Sales managers can answer these questions with sales analytics using BI software solutions.
Marketing
Marketing professionals run many marketing campaigns across many channels. How effective each of these campaigns are, how marketing metrics like page views to visitors to sign ups are doing, the top five performing regions, products, and services—these are all questions that marketers want answers to. Find answers to these questions with marketing analytics.
Finance
Looking beyond the balance sheet, cash flow, and profit and loss statements, smart finance professionals right to the CFO level, now ask deep questions of their financial data. Financial analytics provides insightful answers to those questions.
Human Resources & Recruitment
HR managers need to be on top of the number of people being recruited, those leaving the organization, effective workforce utilization, productivity trends, and more. Recruitment agencies need to monitor metrics like the average time for filling job positions, selection ratio, cost incurred per hire, offer acceptance rate, and which sourcing funnels are effective.
Project management
Project managers need to track and monitor tasks, timesheets, and billing information to measure whether the ROI is effective or not. With project management analytics, it is straightforward to track all these metrics and ensure that the project is on the right track.
Operations
Operational—or admin—expenses form an important part of any organization's balance sheet. CFOs need to always keep a tab on admin expenses, as any leakage here will harm the company's performance.

Start Transforming Raw Data Into Valuable Assets To Grow Your Business Today!
What Our Clients Say
CUSTOMERS


FAQs
What is a business intelligence tool?
A business intelligence (BI) tool is software designed to collect, process, analyze, and present data to help organizations make informed decisions. These tools provide dashboards, reports, and visualizations that summarize complex datasets, enabling users to understand trends, monitor performance, and identify opportunities or problems.
Does business intelligence tool need coding?
Not necessarily. Most modern BI tools like HeroDashboard are designed to be user-friendly and allow no-code solutions, enabling non-technical users to perform data analysis through drag-and-drop interfaces, pre-built connectors, and automated reporting features.
Is Excel a business intelligence tool?
Yes. Excel can be considered a basic business intelligence (BI) tool, but it is not a fully-fledged BI solution like HeroDashboard. Here's why:
Why Excel Is a BI Tool:
✅Data Analysis and Reporting: Excel allows users to perform calculations, create pivot tables, and generate charts and graphs for data analysis.
✅Custom Dashboards: It enables users to create customized reports and dashboards.
✅Data Integration: It can import data from various sources, including databases, APIs, and other files.
✅Accessibility: Widely used and accessible to most organizations for analyzing and visualizing data.
Limitations of Excel as a BI Tool:
✅Scalability Issues: Excel struggles with large datasets and can become slow or crash when handling extensive data.
✅Automation: It lacks built-in automation for real-time reporting or data refresh from multiple sources.
✅Collaboration: Collaboration is limited compared to modern BI tools that allow multiple users to access and edit dashboards simultaneously.
✅Advanced Features: Excel lacks advanced BI capabilities, such as interactive dashboards, predictive analytics, or machine learning.
Conclusion:
While Excel can handle some BI tasks, it is better suited for small-scale analysis and ad hoc reporting. For advanced, scalable, and automated BI needs, dedicated tools like Power BI, Tableau, or Qlik are more appropriate.

